This dashboard feature allows admins to see the current watch usage data as well as the historical watch usage data.
The Watch Usage report is a feature on the Duress dashboard that is available to all admin users of the Duress Dashboard. It displays the current watch usage data as well as the historical watch usage data (from 01.06.2023) as an interactive bar chart.
The Duress Falcon Usage feature lets dashboard admin see the following information per team:
- Total Devices: How many devices does the team have?
- Total Used: How many devices were used in the date range?
- Total Sign Ins: How many watch sessions has this team had in total?
- Currently Signed In: How many devices are currently in use?
On top of the team based information, dashboard admins can also see the following information per watch:
- Historical data of each watch usage session:
- Who was using the watch? (Only if using sharing tablet)
- Start/end time incl. timezone
- Is the device currently in use?
💡 Please note that you'll only be able to view data if your teams are using Duress Falcons. Usage data of Duress Phoenix or App users is currently not supported.
Getting to the page
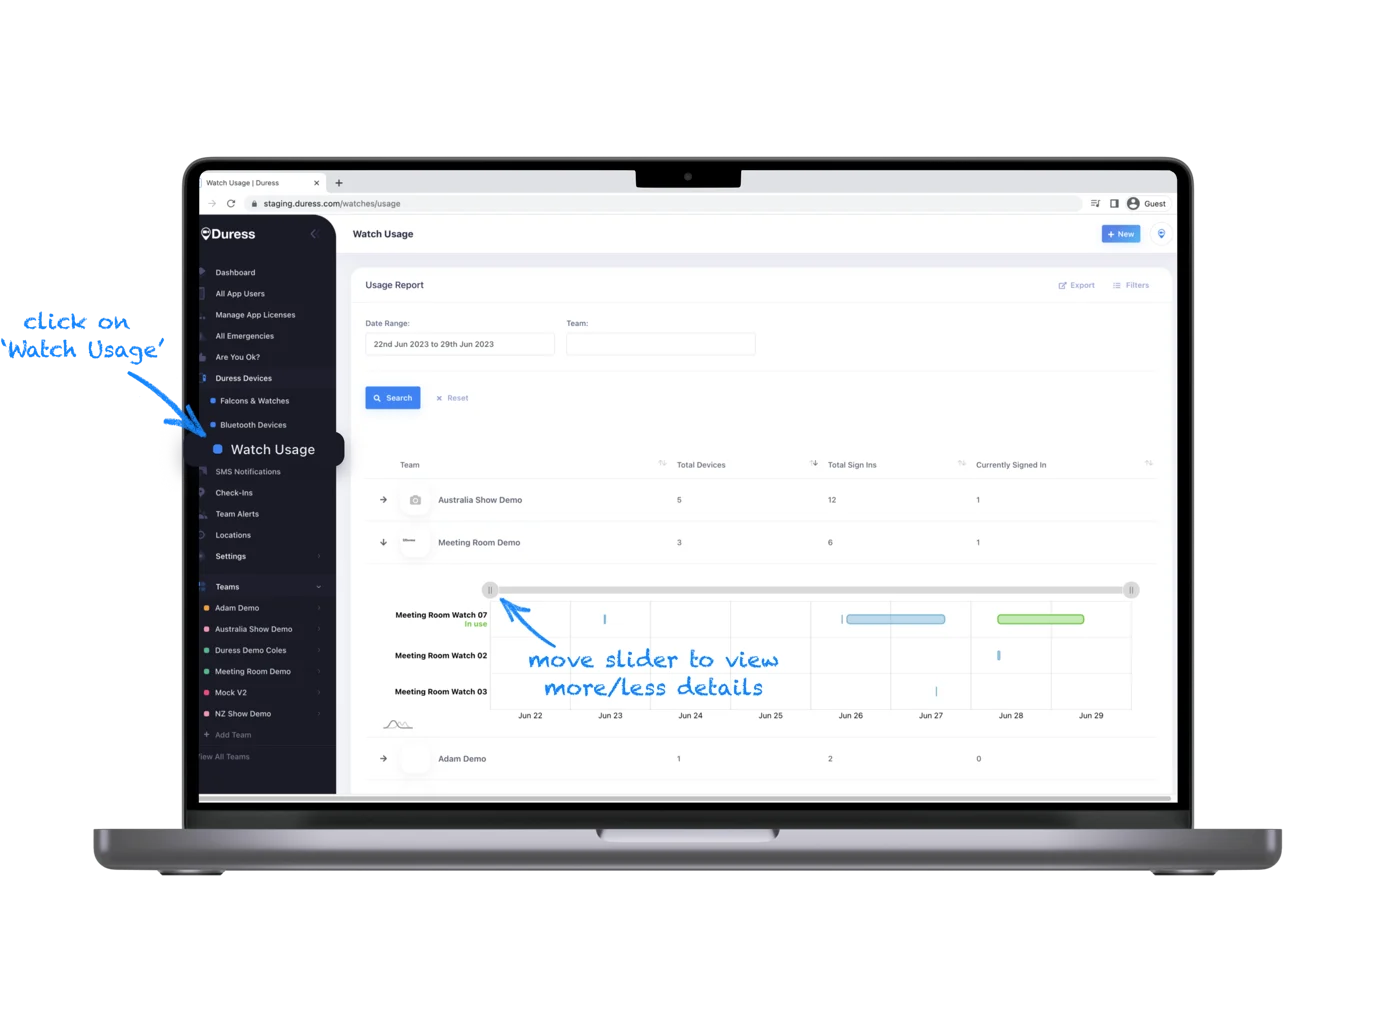
In the main navigation menu on the left hand side of the Duress Dashboard, click on "Watch Usage" under the Duress Devices tab to access the usage reports. Next, click on or search for the team that you would like to view.
Filtering Data
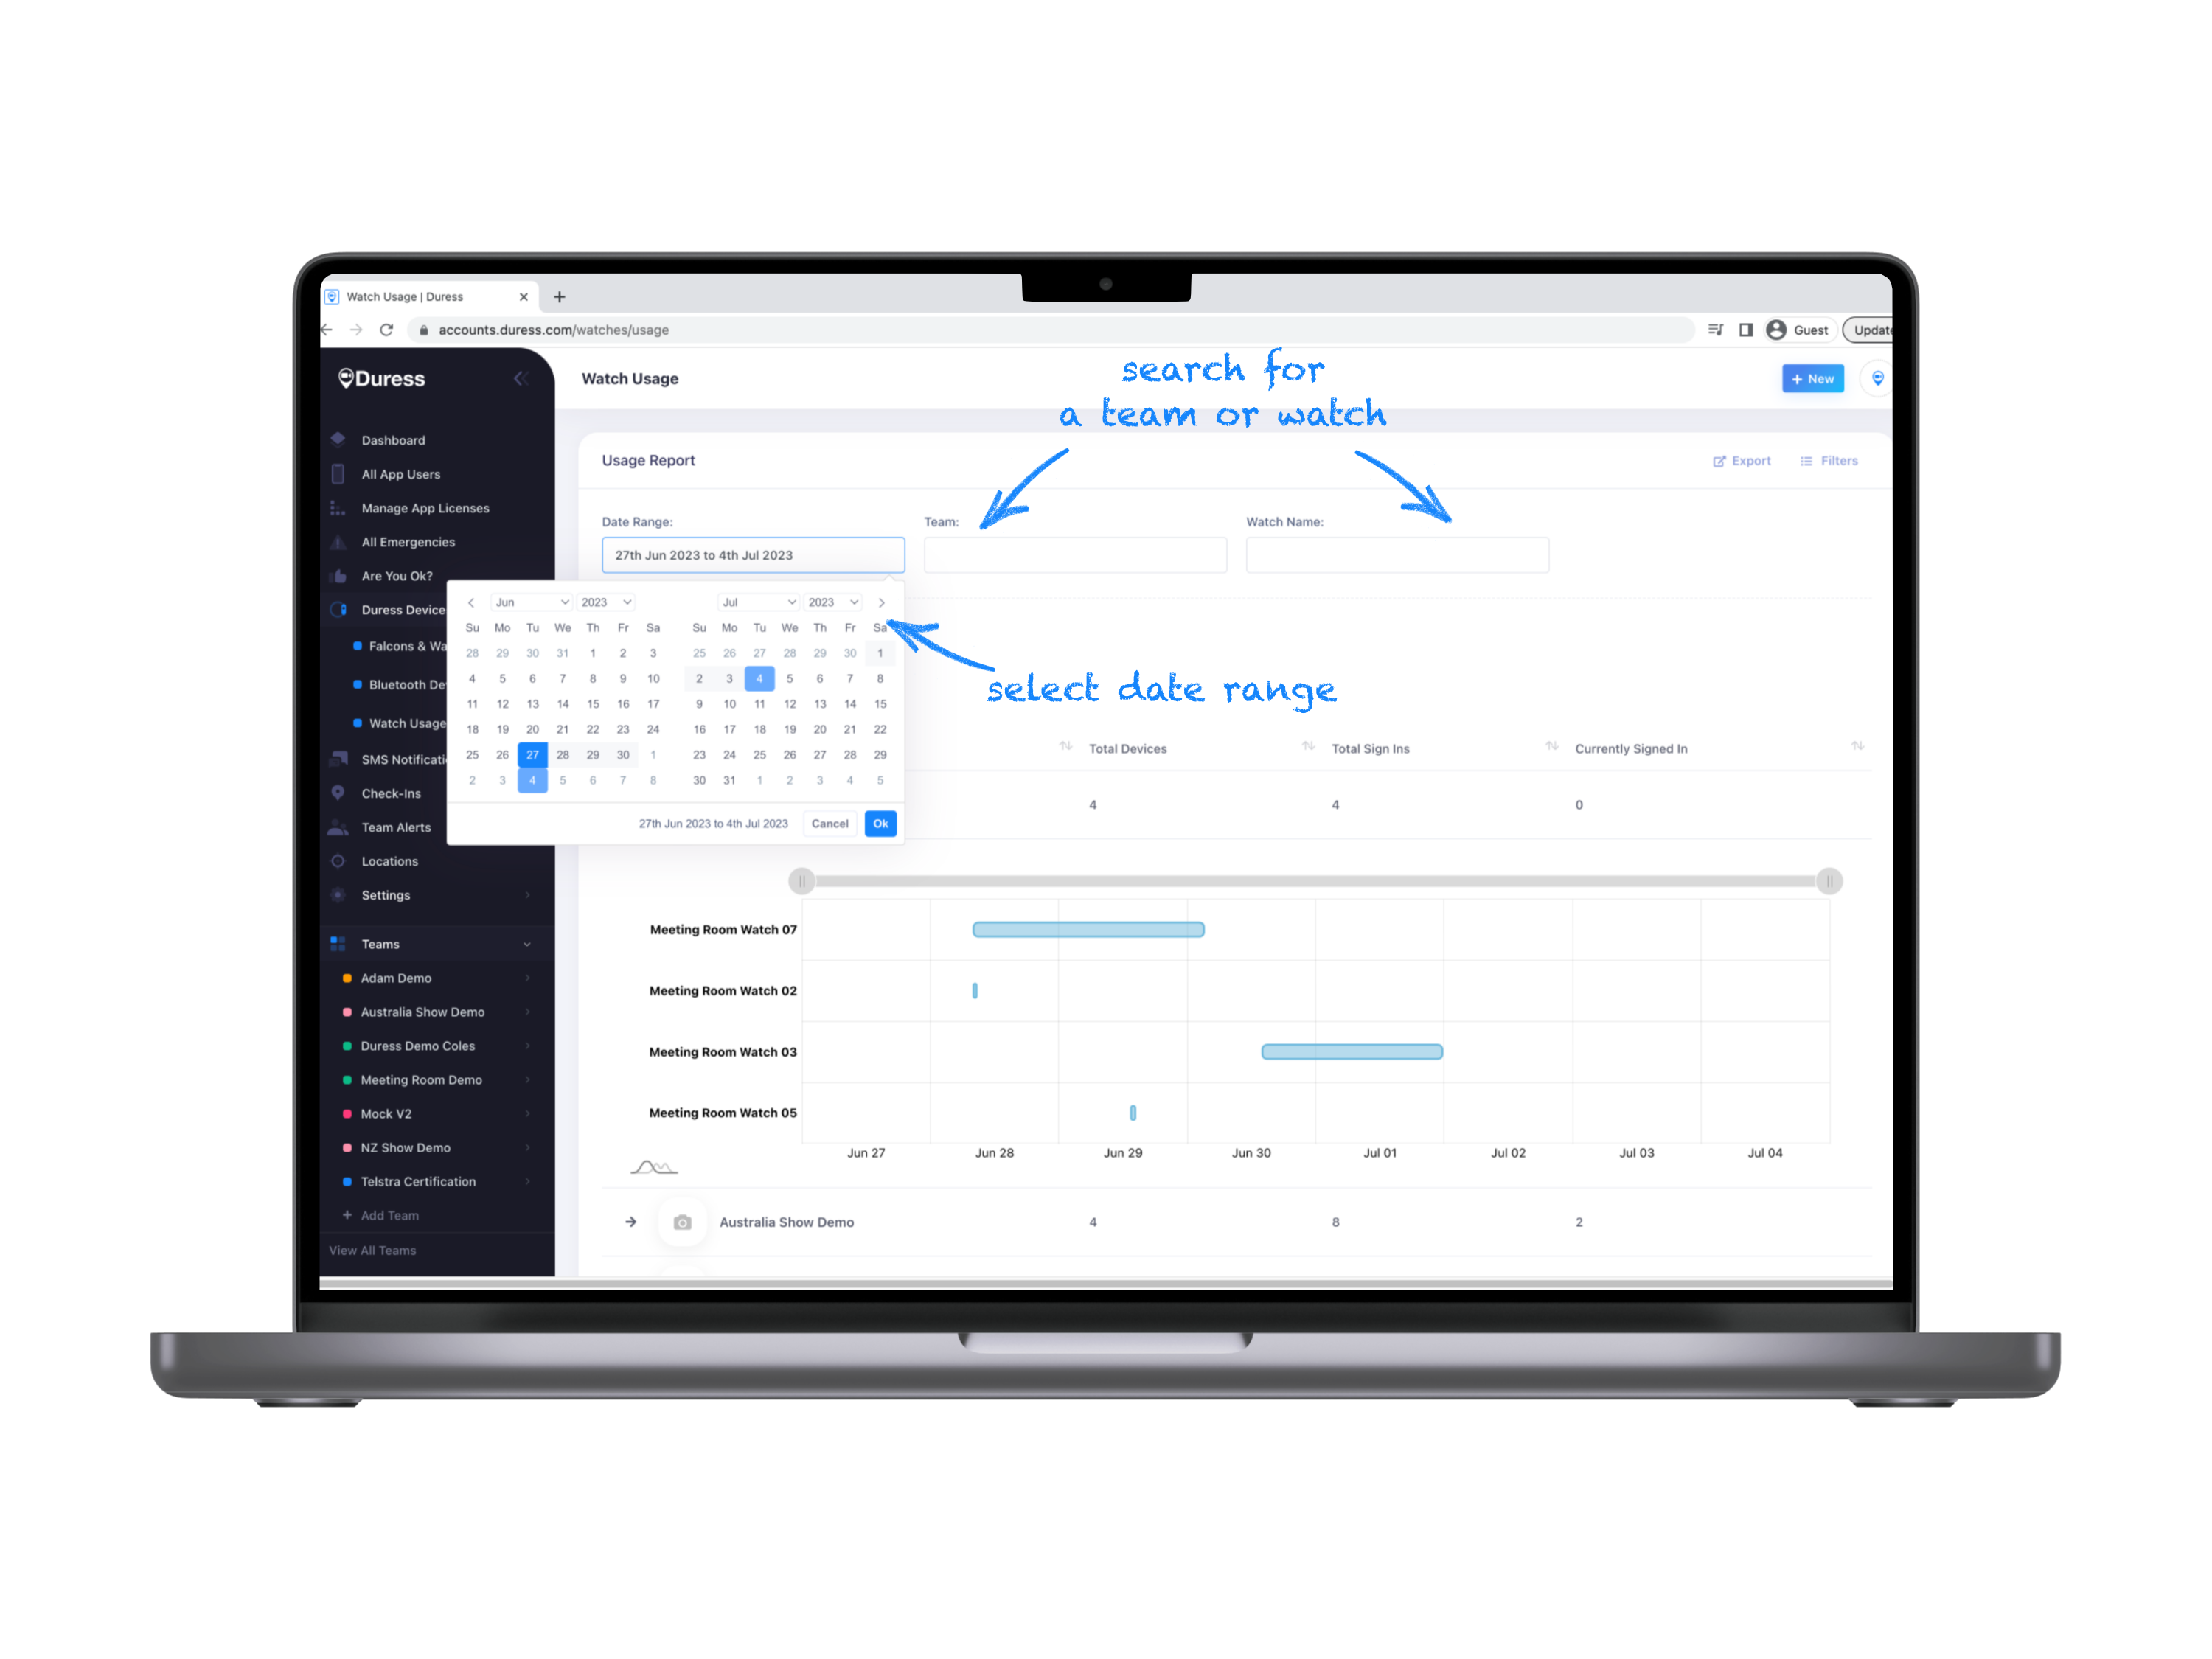
As a default, Duress will show you the historical data of the last 7 days up until the current moment. To view data further back, click on the date range field to open the calendar, where you can select the start date and the end date of the data that you would like to review. You can view any date period, up to 90 days.
You can also search for a specific team or watch by entering the name. Click on "Search" to apply the filters.
Using the Interactive Slider
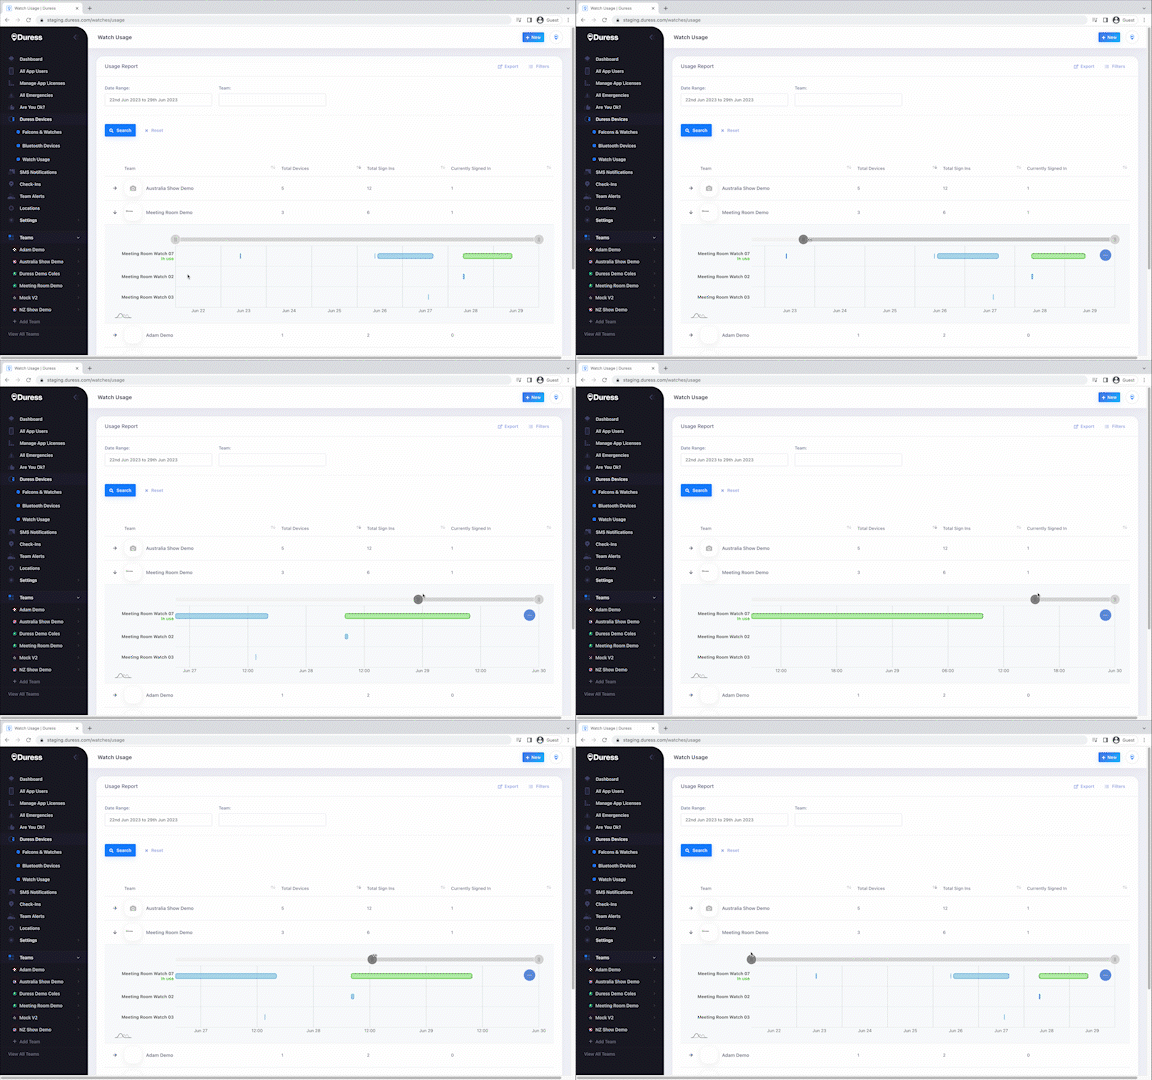
You can move the grey slider to zoom in or zoom out of the date/time range. This lets you view a detailed daily report by the hour, or review a weekly/monthly report, all depending on your needs.
You can also maximise or minimise the date range by scrolling with your mouse.
Viewing Information per Session
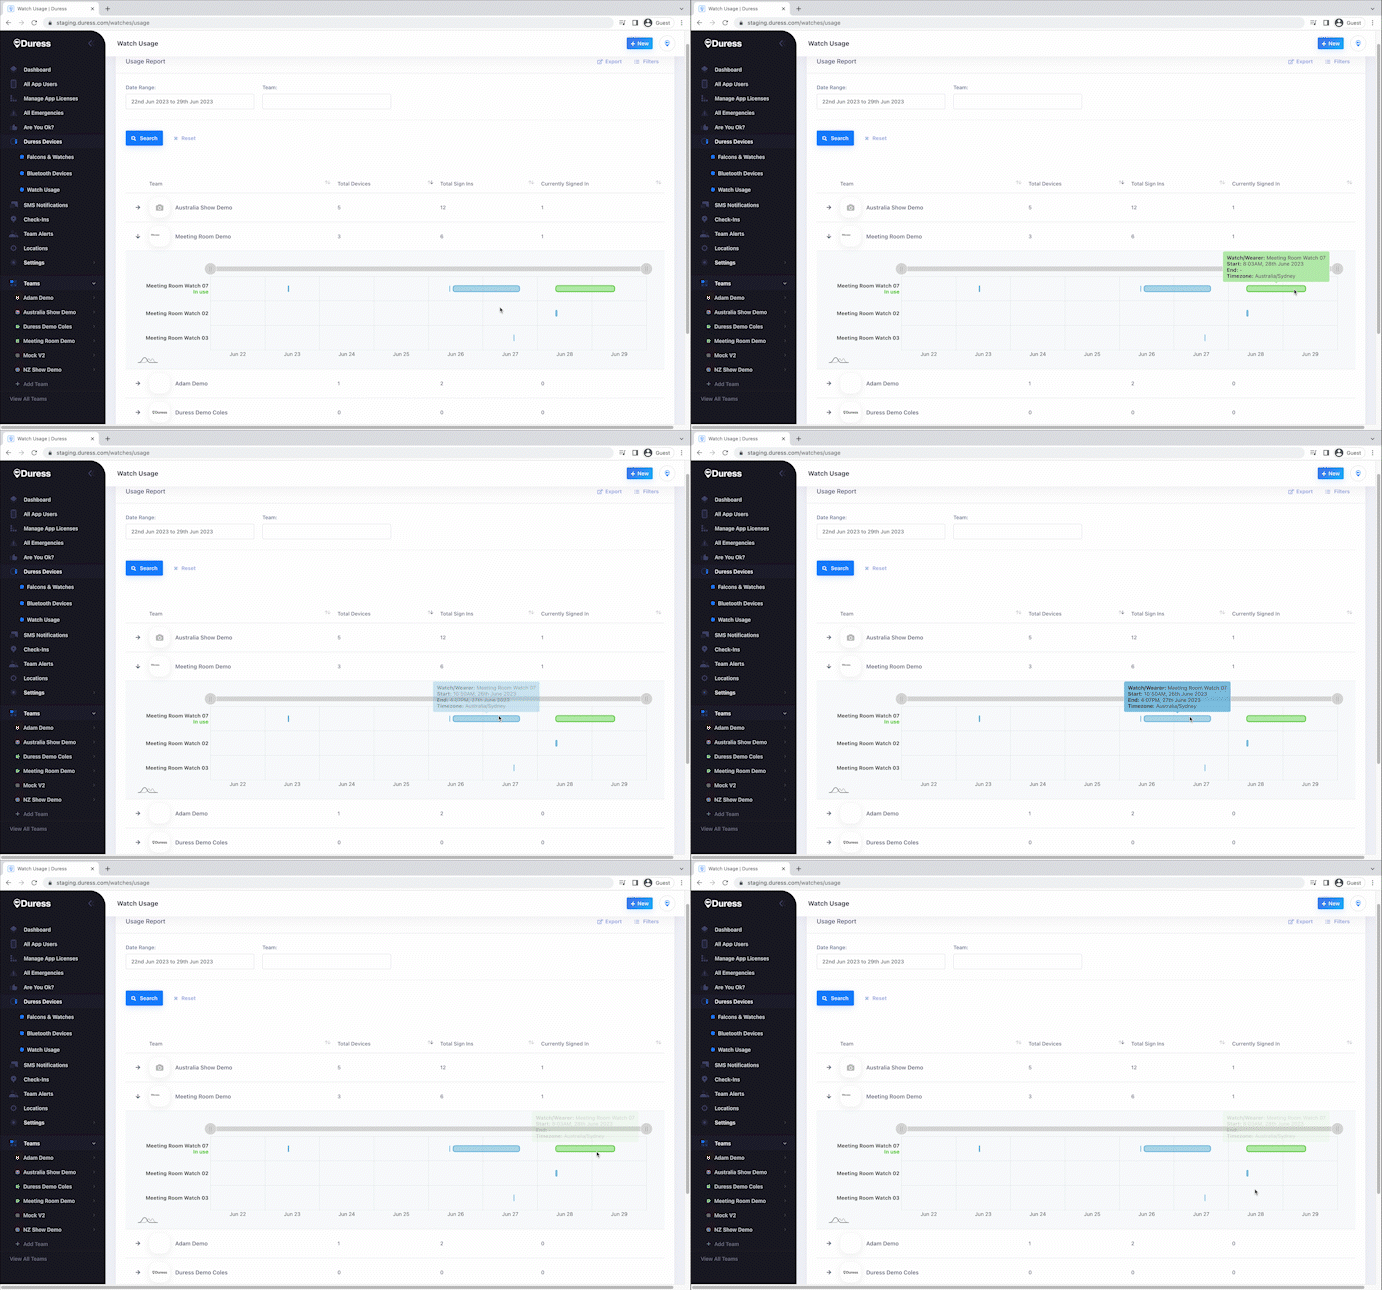
Each bar represents a watch session. Hover over each bar to view that session's information. You'll be able to access the watch's name (or watch user's name if using the sharing tablet), as well as the start and end time of each session.
How does Duress calculate the session times?
When using the sharing tablet, the start time of the session is logged when the Falcon is signed in. This happens when the device is picked up from the charger and a name is selected from the sharing tablet. Similarly, the usage end time is logged when the watch is placed back on the charger and signed out.
When using the Falcon on standalone mode (i.e. NOT using a tablet), the session start time is logged when the device is removed from the charger and the session end time is logged when the device is placed back on the charger.
Please note that there may be a slight delay of receiving the sign in/out data, which may affect the accuracy of the start/end times by up to 30 seconds.
If a watch has not been logged out/docked on a charger after 48 hours, Duress will automatically end the session.
Seeing Live Data
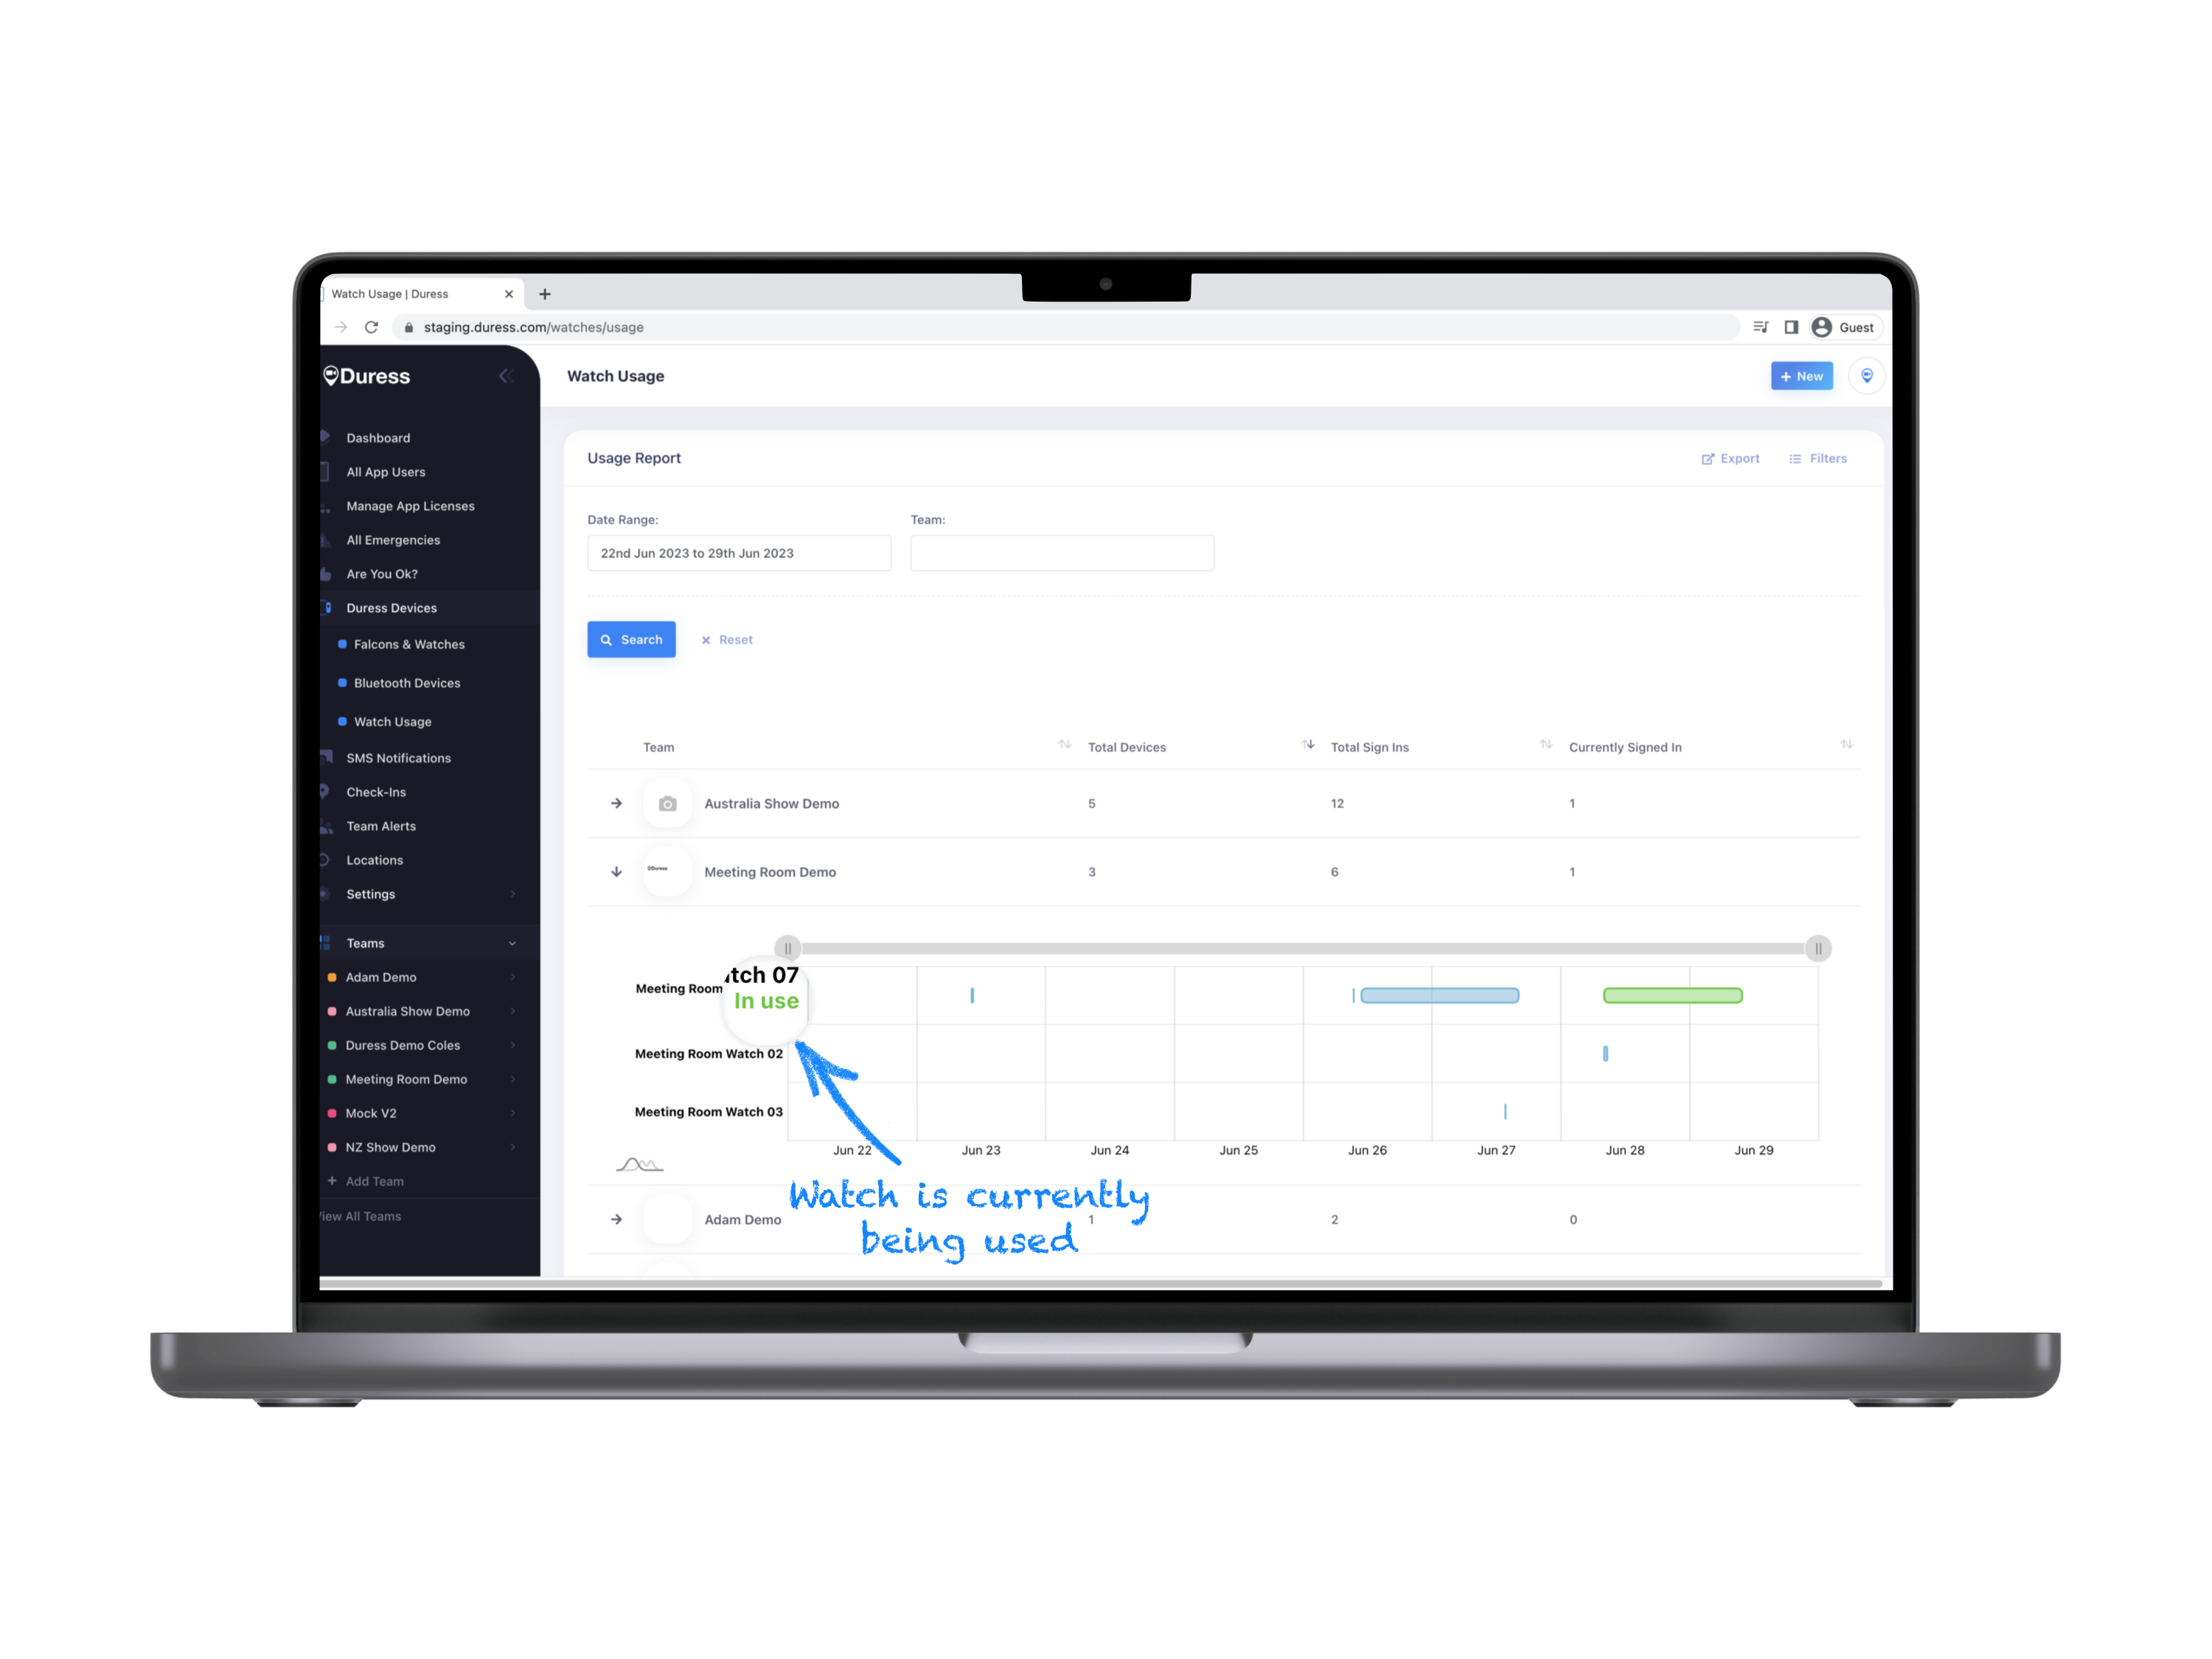
The blue bars represent sessions that have ended. the green bars represent sessions that are currently ongoing. You can also quickly identify devices that are currently in use by the green 'In Use' next to the device's name.
Need Assistance?Our friendly support team are only a call or a click away. |


